Dijet Anomaly Detection
Ongoing research project with Ben Nachman, in the Lawrence Berkeley National Lab ATLAS group
overview
Machine learning is becoming an increasingly popular method of searching for new physics signals at the Large Hadron Collider. One of the most important of these searches is that for resonant new physics, in which a signal is localized to some region of the invariant mass spectrum. A classical “bump hunt” can then be performed to search for this signal in the mass spectrum, as was done to find the Higgs Boson.
In this project, we use machine learning to enhance the visibility of such bumps, using the recently proposed methods SALAD and CWOLA.
personal contributions
I joined this project full-time in the spring of 2020, with funding from the SULI program. My work was to analyze the performance of and extend the reach of recently developed algorithms SALAD and CWOLA with my mentor Benjamin Nachman, a staff scientist at LBNL.
I sought out Ben as a mentor because I had worked on & was very interested in semi-supervised ML projects for anomaly detection before. From reading various other papers and discussing with my colleagues on the CMS collaboration, I had the impression that Ben was very much a leader in the field.
Working on this project has been very exciting for me. Through a combination of previous research experience, knowledge of HEP ML techniques, and fantastic mentorship, I have been able to make consistent & unique contributions to this project. This has meant posing & pursuing my own research questions, introducing & testing unique modifications to algorithm routines, and preparing & presenting talks and papers on this work for conferences and ATLAS internal meetings. This experience has made me excited to start work in a PHD program, and reinforced my desire to pursue a career in particle physics research.
Day-to-day research tasks
- Re-implementing them and verifying their initial results
- Applying SALAD to ATLAS group data
- Checking SALAD’s response to data correlations
- Quantifying SALAD’s ability to estimate the signal-region background across a number of plausible signals
- Synthesizing this information in the form of a concrete analysis plan
All of these tasks are implemented in Python, using Keras/Tensorflow for the machine learning, and run on the NERSC’s CORI supercomputer. This work served the purpose of clarifying the performance of SALAD, working out several bugs and workarounds in its implementation, and preparing it for large-scale application to ATLAS group data in a dedicated search.
A paper on our work since this spring has been accepted to the 2020 NeurIPS conference (Machine Learning for the Physical Sciences workshop), which I will be presenting. This work has also been submitted for review to a particle physics journal.
A majority of the results from this project cannot be displayed here, since they are internal to the ATLAS group. If you are an ATLAS group member and would like to see more, please contact me. For all of the following plots, I use the Pythia and Herwig based simulations from the 2020 LHC Olympics.
algorithm and datasets
The most basic version of SALAD (Simulation Assisted Likelihood-free Anomaly Detection) proceeds as follows:
-
Choose a set of features \(m\) which localize a possible signal into a signal region \(R_\text{signal}\) (where the signal might be more plentiful), and a sideband region \(R_\text{sideband}\). Choose additionally a set of discriminating features \(x\).
-
Generate both a real dataset and a decent simulation with these features.
-
Train a classifier \(f(x, m)\) to distinguish between data and simulation for \(m \in R_\text{sideband}\).
-
Reweight the simulation using \(f(x,m)\) according to the DCTR procedure, with weights given by
\[w(x | m) = \frac{f(x, m)}{1 - f(x, m)}\] -
Train a second classifier \(g(x)\) to distinguish reweighted simulation and data for \(m\in R_\text{signal}\).
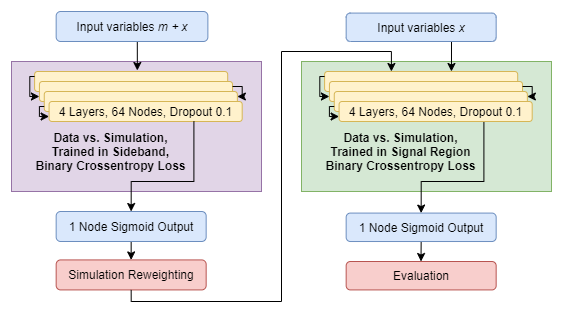
This algorithm is semi-supervised, and can have varying degrees of signal-model independence. Signal model independence generally decreases as the set of localizing features \(m\) increases; in the limit of many features \(m\), we basically just have a standard HEP bump hunt analysis.
Since ATLAS data is not available publicly, I’ll use the fully simulated LHCO data described above to show my results, taking the Pythia simulation to be “data” and the Herwig simulation to be “Simulation.” Since they are fundamentally different, this provides a good test case for our algorithms.
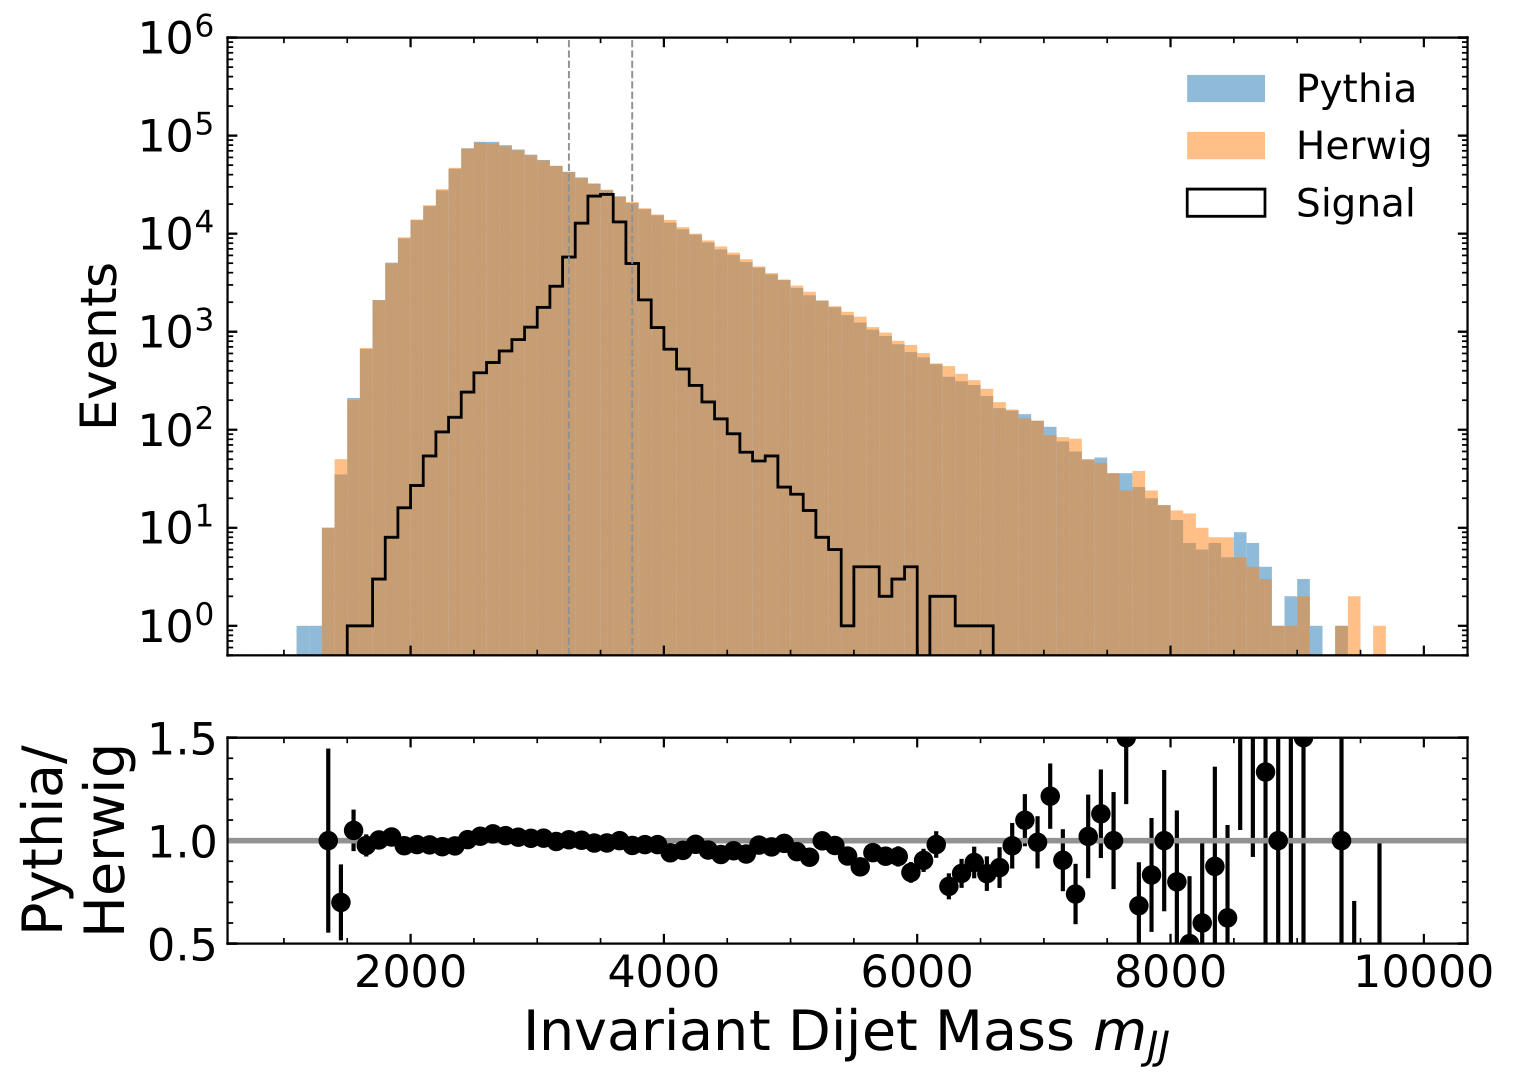
We opt to search for a common signal, of the form \(Z \rightarrow X,Y\), where \(X\), \(Y\), \(Z\) are all bosons and \(Z\) is some hypothetical new particle. This is a dijet resonance, and the signal is resonant (and thus may be localized) in invariant dijet mass \(m_{JJ}\). For testing, we used a Pythia signal simulation where \(Z\) is a hypothetical 3.5 TeV \(W^\prime\) boson.
We then choose a signal region width (500 GeV, in this case) and slide it across the \(m_{JJ}\) spectrum, training models and searching for signal patterns at each place. For testing and computational convenience, we show results for a signal region centered on the peak of the \(W^\prime\) resonance:
Though I added many more features with the ATLAS dataset, this dataset was limited to the jet masses and \(n\)-subjettiness ratios \(\tau_{21}\) and \(\tau_{32}\), though this is still an improvement from earlier iterations. The features are shown below; note that in features other than \(m_{JJ}\), the Pythia and Herwig simulations exhibit significant differences.

reweighting results
The reweighting in step 4 can be verified visually, and with a variety of distribution similarity tests. A typical example of these results are shown below for a very high signal to background ratio (\(S/B\)).
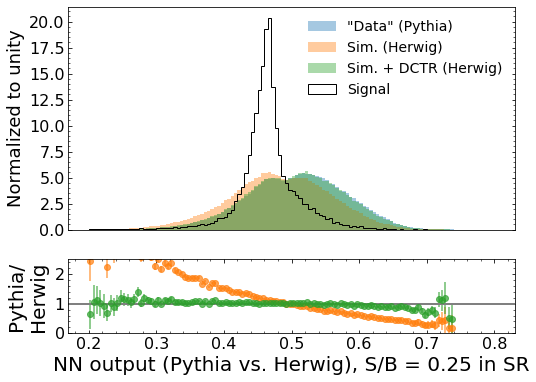

It is obvious from the “Pythia/Herwig” ratio plots that the reweighted distribution, shown in green, are a much better match to the “data” than the non-reweighted distributions.
classification results
Here I will show a few of the performance tests I performed. This is only a very small subset, since I am not able to share ATLAS internal data/documents. However, even these tests are interesting.
First, we can show SALAD’s discovery potential over a range of \(S/B\) ratios, with no modifications. It is clear that the performance is quite good, even at fairly low ratios:
convenience, we show results for a signal region centered on the peak of the \(W^\prime\) resonance:
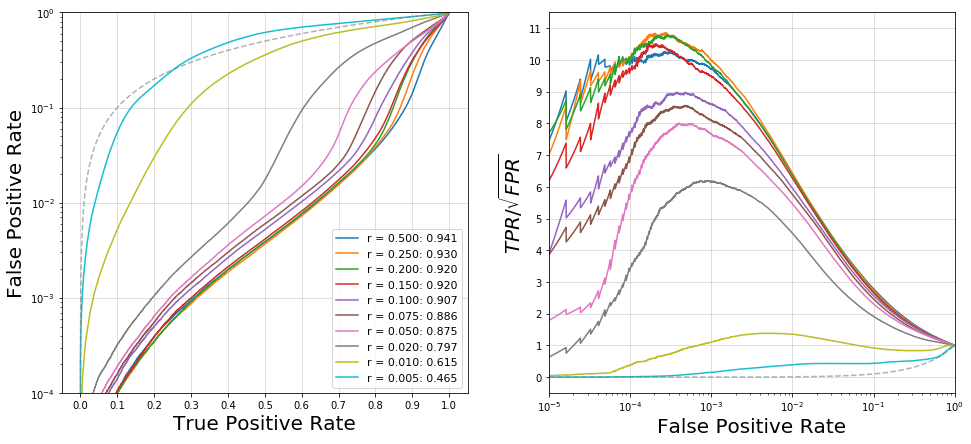
Next, we can verify SALAD’s robustness to correlated inputs by inducing a strong correlation between jet mass and \(m_{JJ}\). This is done by modifying the jet masses such that \(m_J \rightarrow m_J + 0.1\cdot m_{JJ}\) for each jet mass \(m_J\). These results are shown as well
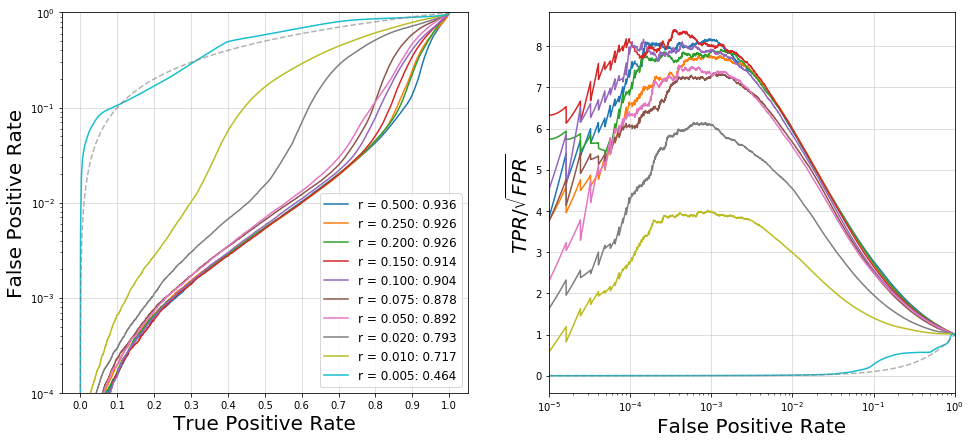
We see that performance is comprable, with a boost in performance in the low \(S/B\) region. Either way, it is clear that SALAD is robust to even very strong correlations.
We can also plot metrics such as the AUC and maximum relative significance \(\epsilon_S/\sqrt{\epsilon_B}\) for these models to compare them more directly. Here we plot the median and IQR of 20 models trained at each point:
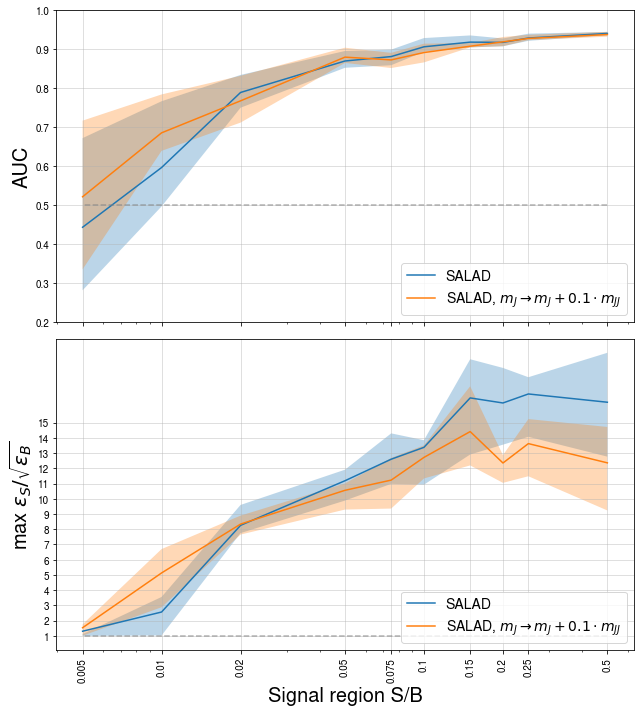
We see from these plots that the performance of SALAD on this test dataset is both quite good, and robust to correlations between resonant and discriminating features.